CEF Vs UTF Performance
Closed-End Funds
Performance of Closed-End Funds
Why the need to measure?
In spite of the popular caveat that “past performance is not a guarantee of future results”, the historical performance of closed-end funds (CEF) or of any investments is an indispensable guide and a definite “must-have” for any serious investor. In the absence of such data, it is difficult to gauge the skills and success of the respective fund managers and the potential returns of the funds. Furthermore, investors would also be deprived of a powerful tool to quantify, assess and compare the performance of various funds and investment alternatives.
How to measure?
In measuring the performance of CEF, there are 2 distinct but related parameters involved. Unlike the performance of unit trusts funds (UTF), which is based solely upon the UTF’s net asset value (NAV), the performance of CEF can also be measured based upon the fund’s share or market price. Herein lies the difference. The former measures the performance of the fund manager in managing the assets of the fund while the latter measures the actual returns (price performance) of the CEF.
(i) Performance of fund managers
The best way to measure the skill and performance of the fund manager is to calculate the returns based on the fund’s NAV. A CEF’s NAV is the summation of the fund’s assets (regularly marked to market) after deducting its total liabilities. The NAV is then divided by the number of shares outstanding, in order to obtain the fund’s NAV per share, as shown below.
The returns are then calculated based on the formula below.
(ii) Investment returns
As CEFs have fixed number of shares and are traded on exchanges, the market prices (MV) quoted could diverge from its underlying NAV, as dictated by the forces of supply and demand. This is known as the premium or discount (to be further discussed in a later issue of i Capital). Due to the existence of this premium or discount, investors can earn higher or lower returns than those registered based on the fund’s NAV, depending on the magnitude of the premium or discount.
The returns are calculated based on the formula below.
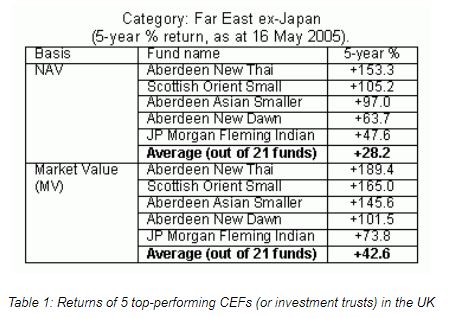
Table 1 is an example of the difference between the returns based on NAV and market value (MV).

At a glance, one would notice that there is no difference in terms of ranking of the top 5 performing CEFs when measured based on their NAV or MV returns respectively. However, the magnitudes of the returns differ when one compares the performance based on their NAV and MV respectively.
For instance, the highest ranked fund based on NAV, ie Aberdeen New Thai, recorded a 153.3% cumulative return over the 5-year period whilst its MV or market price performance over the same period was substantially higher at 189.4%. What this means is that although the fund manager has successfully grown the NAV of the fund by 153.3%, its share price has appreciated much more. Interestingly, upon closer inspection of the table above, this is not an exception but rather a norm as shareholders of all the CEFs would have made higher returns (based on MV) compared with the returns achieved by their CEFs (based on NAV). This additional return, either by a narrowing of an existing discount or a widening of an existing premium or a move from a discount to a premium, is a unique feature of CEFs and will be further discussed in a later issue of i Capital.
Other important issues
(A) Role of the Fund Manager
Generally, much emphasis has been placed on the track record of funds but not much attention has been given to the more important factor of what is driving that performance. Looking at table 1 again, the fact that there is a huge disparity in returns of the top 5 performing CEFs compared with the average returns of 21 CEFs within the same category (+42.6%), highlights the crucial role played by the fund manager in the overall scheme of things. Ceteris paribus, it is the skill and ability of the fund manager that differentiates a superior fund from an average fund. Hence, it is not uncommon to witness deterioration of performances of top funds upon the change in their fund managers. In short, while it is common for many to focus on past performance as a measure or guide to future performance, one should instead place more emphasis on who the fund manager is and how he or she will be able to maintain such performance in future.
(B) Calculation of total returns (including dividends)
When evaluating the performance of CEFs, investors should focus on total returns, as opposed to just changes in price. This is to take into account the effects of distribution of dividends. Based on the example shown below, the returns from ABC fund could differ greatly from as low as 22.2% to as high as 35.8%, depending on how it is measured. It is also evident that the price total return of ABC fund is significantly higher than just looking at the changes in price. Hence, investors should be aware of the effects of dividend distribution on their investment and not merely measure the performance of the CEFs based purely on their underlying market price.
Example: ABC fund

(C) Use of benchmarks
In addition to measuring the returns, investors should also use benchmarks (indices like KLCI, Nasdaq, S&P 500, Nikkei 225, etc) to relate the performance of the funds. It is not a great deal, for example, if ABC Fund achieved a 10% return while the general market rose 20% during that same period. It is also worthy to note that the choice of benchmarks is just as crucial so as to provide an accurate comparison. For example, funds that invest in US companies with small capitalization should not gauge themselves against the DJIA, which is made up of 30 large-capitalised stocks.
(D) Comparing like with like
Another way to measure and compare the performance of CEFs is to pit them against their peers. By grouping funds with similar investment objectives and geographical regions (place of investments), an investor is able to gauge the skills of the respective fund managers in managing the assets under a similar mandate. It also allows the investor to identify and pick-out a consistent out-performer that befits its own investment objectives from the crowded group of funds available in the market.
(E) Other key parameters
Other key parameters that investors should pay attention to when measuring performance of CEFs are the Expense Ratio and Portfolio Turnover Ratio. The former, measured by dividing the fund’s expenses by the average net asset value (NAV) of the fund, basically gives an indication of the operating expenses of the fund, relative to its size. Meanwhile, the latter is derived by dividing the average value of the fund’s acquisitions and disposals over the fund’s average net asset value (NAV) and thus, measuring the amount of portfolio churning carried out by the fund manager.
As expenses eat into the returns, funds with low expenses and low portfolio turnover will generally out-perform over the long-term, assuming the assets are the same. Moreover, as both are measured relative to the size of the fund’s NAV, these ratios allow an investor to compare the performance of fund managers across all groupings and fund classes.
Unit Trust Funds
Performance of Unit Trust Funds
As the performance of UTF has been widely reported in the newspapers, magazines etc, i Capital will not repeat what has been published. i Capital will instead focus on analysing issues related to UTF’s performance, which has been avoided by most media.
[a]. How to measure performance
For UTF, the most used performance measurement is to calculate the changes in NAV or NAV per unit of the UTF between 2 periods, inclusive of distributed dividends. This is known as NAV-to-NAV return. The formula for NAV-to-NAV return is:
[b]. Important issues pertaining to UTF’s performance
[i]. The suitability of using NAV-to-NAV return as a measurement of unit holders’ return
Most do not realize that NAV-to-NAV return only serves as a measurement of the performance of the fund manager, NOT the returns enjoyed by unit holders because NAV-to-NAV measurement excludes loadings, both front and back, that are paid by investors when buying/selling a UTF. For example, AUTB Investment Fund (AIF) charges a front load fee of 6.25%. Table 2 shows the difference between NAV-to-NAV return and a unit holder’s actual return if investors bought AIF on 1 Mar and sold it on 30 Mar. With the front load, unit holders have actually suffered higher losses (-8.92%) as compared with the losses calculated using the NAV-to-NAV method (-3.22%).

Another issue with the NAV-to-NAV method is that each UTF differs in terms of loading. For example, Pacific Recovery Fund (PRF) charges a front load of 6.88% whereas P.Master Equity Growth Fund (PMEGF) charges a front load of 5.50%. Table 3 below shows the buying and selling price for both funds as at 1 Mar 2005 and 30 Mar 2005.

From the example, although PRF recorded lower NAV-to-NAV losses than PMEGF, PRF’s higher front load has eaten into unit holders’ return, thus causing its unit holders to experience higher losses than PMEGF’s unit holders.
The conclusion here is that the NAV-to-NAV measurement is useful in gauging the ability of the fund manager to increase the NAV of the funds under their management, and not as a basis for determining which fund can give investors the highest return.
[ii]. Use of benchmarks
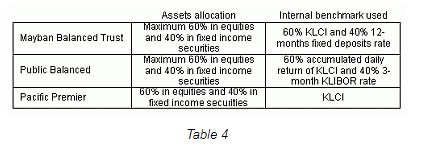
UTFs in Malaysia report their performance together with a certain benchmark, either one that is based on general market index like the KLCI or one that is internally generated based on their asset allocation. Why is the use of benchmark important? For one, it gives investors a fairer representation of the fund manager’s performance relative to the general market. A fund manager only adds value if he outperforms the general market or the chosen benchmarks. The next important point is the choice of benchmark. The most ideal way is to use one that closely mirrors the investment objectives and assets allocation of the UTF. For example, if it is a fund that invests primarily in technology companies, one should use a technology Index as opposed to KLCI or EMAS indices. In the case of balanced funds, investors should be wary of how UTMC derive their internally generated benchmarks. For instance, table 4 highlights 3 funds with similar investment objectives and asset allocation but having 3 very different internal benchmarks. Hence, it is important for investors to know what and how internally generated benchmarks are derived before the performance of funds can be compared.

[iii]. Cost and performance
Unlike investing in the shares of a closed-end fund where the costs involved are pretty straight forward, the same cannot be said for UTF. The creative cost schemes invented by fund managers in this industry has made calculating UT’s cost an arduous task. Costs cannot be disregarded. Assuming that everything else is the same, an additional Ringgit of cost is a direct reduction of a Ringgit in returns. There are 2 major costs that are charged to a UTF – [i]. management expenses and [ii]. transaction cost. Bear in mind that these two costs are additional costs borne by the unit holders in addition to the loadings. Most do not notice these costs for they are charged directly to the UTF.
Management expenses
Management Expenses Ratio (MER) is used to measure the expenses incurred by a fund relative to its size. It is derived by the following formula:
Management expenses include investment advisory fees, administrative costs and other expenses such as custodial and trustee fees, taxes, audit expenses and audit fees. The higher the management expenses, the lower the returns. The attention that i Capital would like to draw here is related to an index fund. An index fund simply holds an entire basket of stocks that makes up an index and is passively managed. Whatever the index has, it has. A pure index fund will mimic the index entirely up to the percentage of representation of each counter in the index. The issue here is that locally, the fund management fees charged for an index fund is relatively high, usually 1% and above. Why should investors be paying such high fees when the fund managers are practically holding index companies?
[ii]. Transaction Costs
Transaction costs (ie brokerage fees) are “invisible” costs that are not reflected in the MER. To clarify this, say, Fund A purchased RM150 mln worth of shares and incur a transaction cost of 0.5%. The transaction cost of RM0.75 mln (0.5% X RM150 mln) will not be recorded as a cost, but as part of the cost of purchase, bringing the cost of purchase to RM150.75 mln. Say Fund A on the same day sold RM100 mln worth of shares. The brokerage fees of RM0.5 mln will not appear as expenses but as a net receipt on disposal of shares, meaning Fund A recorded net receipt of RM149.5 mln. Thus, within the same day, RM1.25 mln worth of transaction fees are incurred without appearing in the income statement. However, investors would still able to see the transaction costs involved by reading the notes to the financial statements.
[iv]. Portfolio Turnover Rate
Portfolio Turnover Rate (PTR) is another significant ratio to look at when analysing the performance of a UTF. PTR is the ratio of the average of the acquisitions and disposals of the fund for the year in relation to the average value of the fund for the year. The higher the PTR, the higher the transaction costs. The formula is as follows.

A new fund usually incurs high PTR, as it is just starting to build its portfolio. There is no standard measurement of what a reasonable level a fund’s PTR should be. After the fund has built up its portfolio, it need not change its portfolio frequently. However, that is not the usual case locally. Take RHB Index Fund (RIF) as an example. For financial year ended 2003, RIF reported a PTR of 0.69 times. This means that RIF was involved in acquisitions/disposals of its assets with value totalling to 69% of its average NAV. The irony here is that [a]. RIF is not a new fund and thus high transactions are not needed, and [b]. RIF only aims to mirror the performance of the KLCI, thus eliminating the need of a high level of portfolio turnover. For an index fund, a 69% PTR seems to be too high.
[v]. Star performers – are they for real?
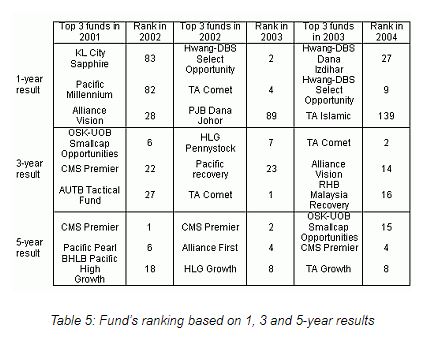
The much publicised unit trust top performers irked our curiosity. Therefore, i Capital did a simple research on the sustainability of the performance of these stars. i Capital ranked the top 10 actively managed equity funds (excluding index, fixed income and money market funds) based on returns as measured by the Edge Lipper for each year and tracked their rankings in the following year. The performance measured is for a 1-year, 3-year and 5-year period.

From table 5, it can be concluded that most of the UTF do not outperform their peers consistently. For example, KL City Sapphire was first in 2001 but dropped to 83 in 2002.
[c]. Role of fund manager
The most common marketing pitch used by UTF is that it allows the man in the street to enjoy professional fund management. Sadly, due to the open-end structure of a UTF, investors themselves end up being the one controlling the buying and selling of the fund’s portfolio, not the fund manager. Allow i Capital to explain. When the stock market is bullish, investors tend to flood new monies into UTFs. When this happens, the UTF receives an inflow of cash and needs to invest the monies received based on their investment mandate. Thus, investors are ‘forcing’ the fund managers to invest, even when some of the shares are trading at high valuation. In a bear market, investors tend to panic and start to redeem or sell their units. Fund managers of the UTF have no choice but to liquidate their portfolio to raise cash to pay the investors who sold or redeemed their units. Thus, investors ‘forced’ fund managers to sell when the stocks may be trading at attractive valuation. In short, the fund managers of UTF are dictated by the emotions of unit holders, thus eliminating the benefits of professional management.