An Evaluation of ICAP’s Performance and Determinants of its Discount

Presented by Dr Lorenzo Casavecchia, Finance Department, UTS Business School
Date: 4th & 5th November 2023


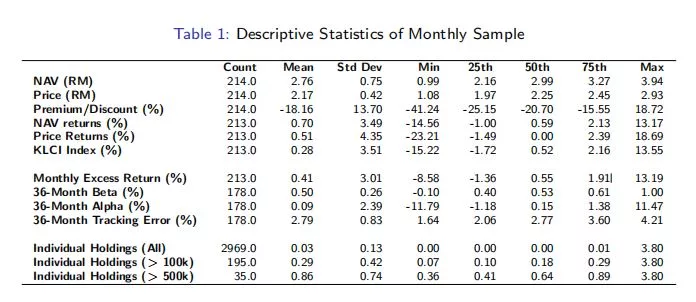
ICAP — Descriptive Statistics

aq jpg

  • Annual Sharpe Ratio: The fund’s annual Sharpe ratio is 0.38—for every unit of total risk, ICAP has provided a return of 0.38 units above the risk-free rate.
  • Annual Information Ratio: The fund’s annual information ratio is 0.48—on average, ICAP has outperformed its benchmark by 0.48 units of tracking error.
  • Annual Jensen’s Alpha: The fund’s median annual alpha is 1.84%—ICAP has outperformed the KLCI by a large margin. Annual Excess Return=8.4%–6%=2.4%


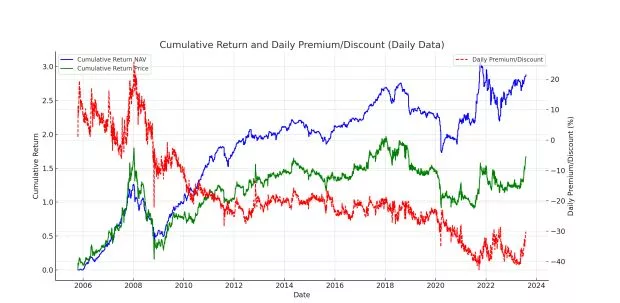
ICAP — NAV Return, Price Return and Premium/Discount

  • Blue Line: reflects the fund manager’s skill in portfolio management and overall investment strategy. A rising NAV-based return can indicate an ability to identify profitable investment opportunities.
  • Green Line: Represents investor return, and is influenced by the intrinsic performance of the fund (NAV) and several other factors that can cause fund’s shares to trade at a premium or discount to its NAV–is not purely indicative of the fund manager’s skill.

aq1 jpg


Academic Explanations for CEF Discounts

  • Luck of Management Skill: Perceived lack of skill can result in a discount to NAV if shareholders believe that poor management is eroding fund NAV.
  • Liquidity Transformation: Concentrated institutional ownership in CEFs can reduce theliquidity of floating shares, making them less liquid compared to the fund’s underlying assets.
  • Distribution Policies: Policies affecting payouts can influence discounts or premiums.
  • Discount-aggravation Strategies: opportunistic investment strategies aiming at worsening the discount (e.g., by reducing liquidity transformation) to profit from (eventual) fund liquidation following management/board replacement.
  • Asset Allocation and Risk Misalignment: Managers might take on too much or too little risk compared to what shareholders desire, therefore leading to greater discounts.
  • Management Fees: High management fees can be a deterrent, leading to a discount.
  • Domestic Bias and Lack of International Exposure: Closed-end funds investing primarily in their home exchange suffer from larger discounts due to lack of retail investors’ benefits from exposure to international assets.
  • Tax Liabilities: Potential tax burdens from unrealized capital gains—This does not apply to Malaysian CEFs.
  • Sentiment and Noise Traders: Irrational trading can drive prices away from NAV.


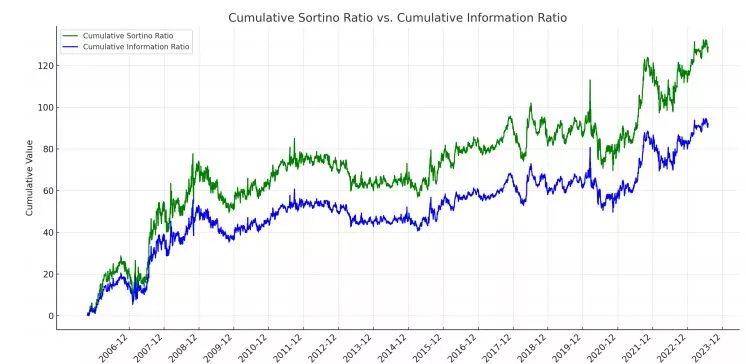
ICAP’s Risk-adjusted Performance vs. KLCI Index

  • The cumulative Information Ratio (IR) suggests that ICAP has been successful in generating excess returns relative to the benchmark (KLCI) for each unit of active risk taken.
  • Additionally, the cumulative Sortino ratio (SR) indicates that the fund has effectively managed downside risk, achieving superior returns relative to the negative volatility. In economic terms, this suggests skilled management and a successful strategy in capitalizing on market opportunities while effectively managing risks.

aq2 jpg


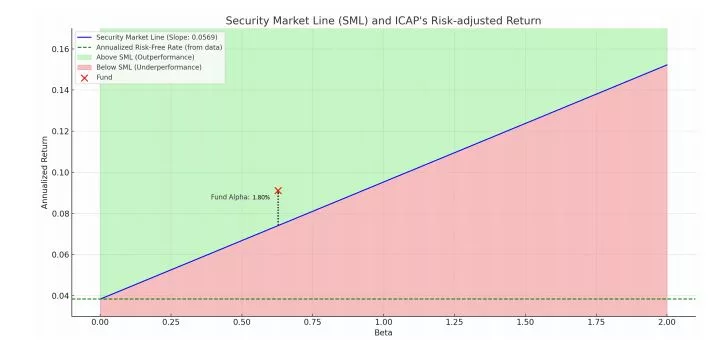
ICAP’s Alpha (α) vs. KLCI

  • The fund’s position above the SML indicates outperformance relative to the expected return for its level of risk (ERP: 5.7%).
  • The estimated annual alpha for the ICAP fund is 1.8% after fees – a significant performance, particularly when compared to that of international peer funds.
  • Overall, the fund has generated an annualized risk-adjusted return that exceeds what would be expected given its systematic risk-taking and prevailing market conditions.

aq3 jpg


Could ICAP’s performance Explain the Discount?

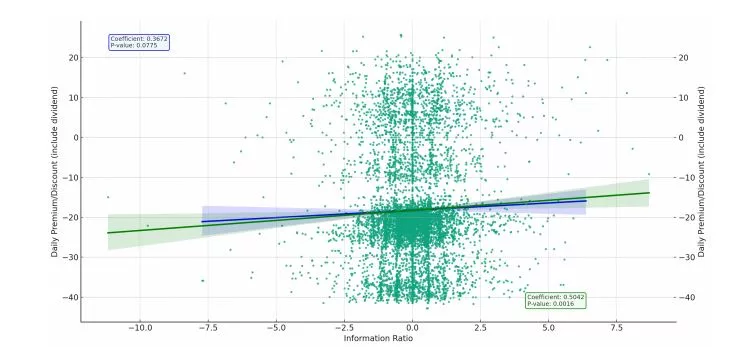
  • Information Ratio (IR): For every unit increase in the IR (blue line), the premium is expected to increase by only 0.3672 units, all else equal. The p-value of 0.077 suggests that this relationship is insignificant.
  • Sortino Ratio (SR): For every unit increase in the SR (green line), the premium is expected to increase by only 0.5042 units, holding all else constant.
  • Implication: Boosts in fund performance do not seem to drive the discount of the fundOther factors are therefore likely to drive ICAP’s discount.

aq4 jpg


Could ICAP’s Asset Allocation Explain the Discount?

  • One possibility is that ICAP’s asset allocation is a source of discount to NAV (univariate ρ = 0.37), if investors prefer heightened risk exposure.
  • In this context, a potential avenue for narrowing ICAP’s discount could be a more substantial allocation towards riskier assets both domestically and internationally.

aq5 jpg

  • However, ICAP’s asset allocation (like NAV performance before) does not seem to drive the discount (see next slide). So, what is causing it?

Could Large Institutional Holdings Explain the Discount?

  • The LHS graph below illustrate ICAP’s discount dynamics vis-`a-vis the percentage of institutional ownership (RHS) from June 2006 to August 2023.
  • This relationship implies that a 1% increase in institutional shareholding is associated with a 1.57% decrease in the weekly premium, all else equal; t-statistic: 3.480. R 2 : 0.669

aq6 jpg

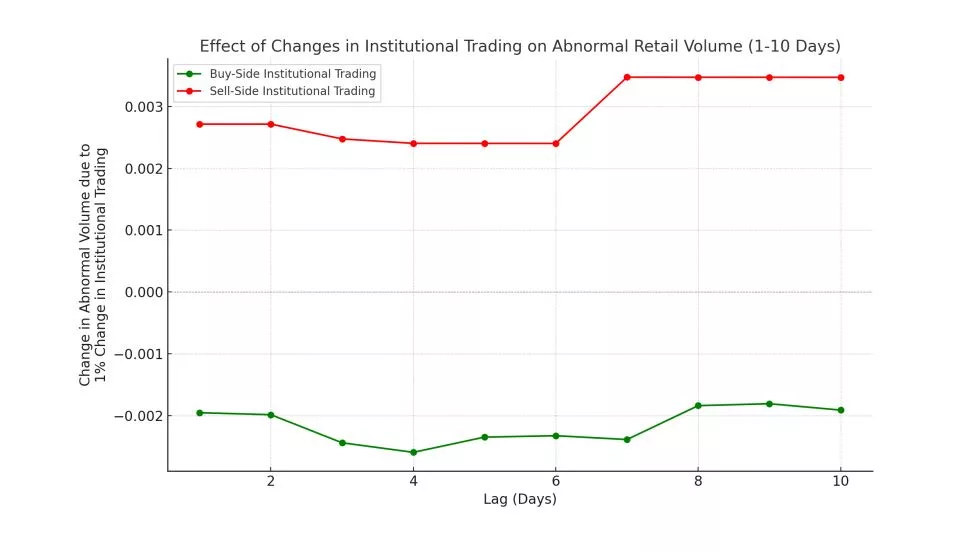
  • In the RHS graph we plot the distribution of the actual percentages of buy-side and sell-side institutional trading. In some trading days, the share of daily volume attributable to institutional trading is substantial.


ICAP Discount — A ”Horse Race” of Factors - And the Winner is...

aq10 jpg


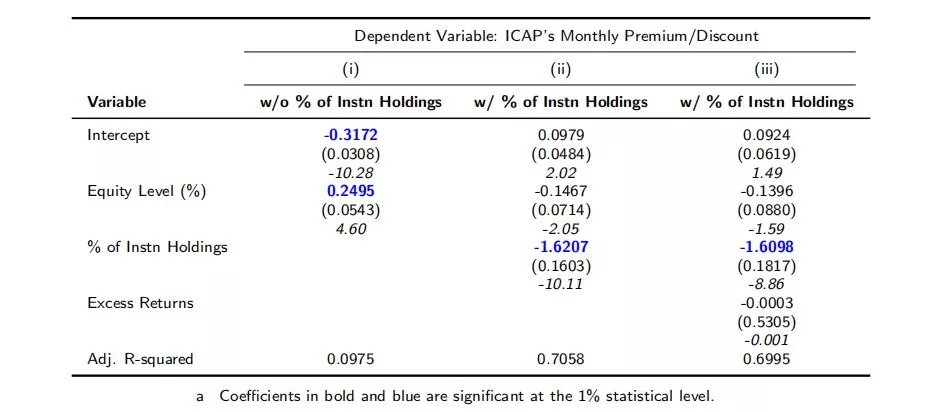
  • Neither ICAP’s asset allocation nor its returns in excess of the KLCI are a significant determinant of the discount—after controlling for institutional holdings.
  • For every percentage point increase in % of Instn Holdings, the monthly ICAP discount increases by about 1.62%, holding other factors constant.
  • At the 1% level, only the percentage of institutional holdings remains a significant determinant of ICAP’s monthly premium/discount.


Institutional Trading, Adverse Selection and Secondary Market (Il-)liquidity

aq11 jpg

aq7 jpg

Interpretation:

  • An increase in buy-side institutional trading leads to a decrease in abnormal retail trading volume in the next 1-10 days—i.e., lower market liquidity.
  • By contrast, an increase in sell-side institutional trading leads to an increase in abnormal retail trading volume in the next 1-10 days—i.e., greater market liquidity.


Granger Causality test — Discount vs. Instn ownership

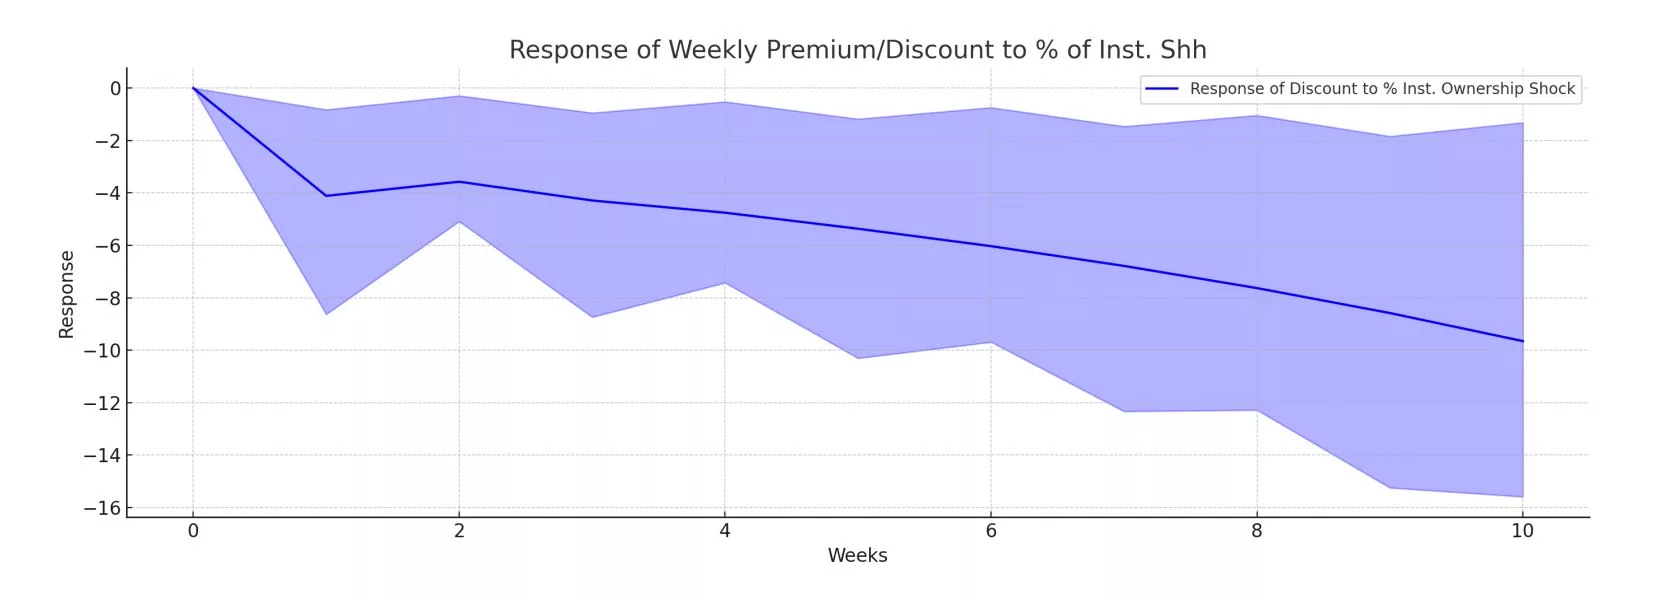
  • At lag 0 (the time of the shock), the response is zero, as expected.
  • At lag 1 (1 week after the shock), there is a noticeable response of the ”Weekly Premium/Discount” to the shock in “% of Inst. Shh”. From lag 2 onward, the response remains relatively stable and within the confidence interval.
  • Unreported result: A shock in the ”Weekly Premium/Discount” does not Granger-cause the “% of Inst. Shh” over the time period.

aq8 jpg

Interpretation: The 1-week response (lag 1) of the ”Weekly Premium/Discount” to a shock in “% of Inst. Shh” is approximately 4.11— a one-percentage shock (increase) in the “% of Inst. Shh” leads to a 4.11% increase in fund’s discount during the following week.

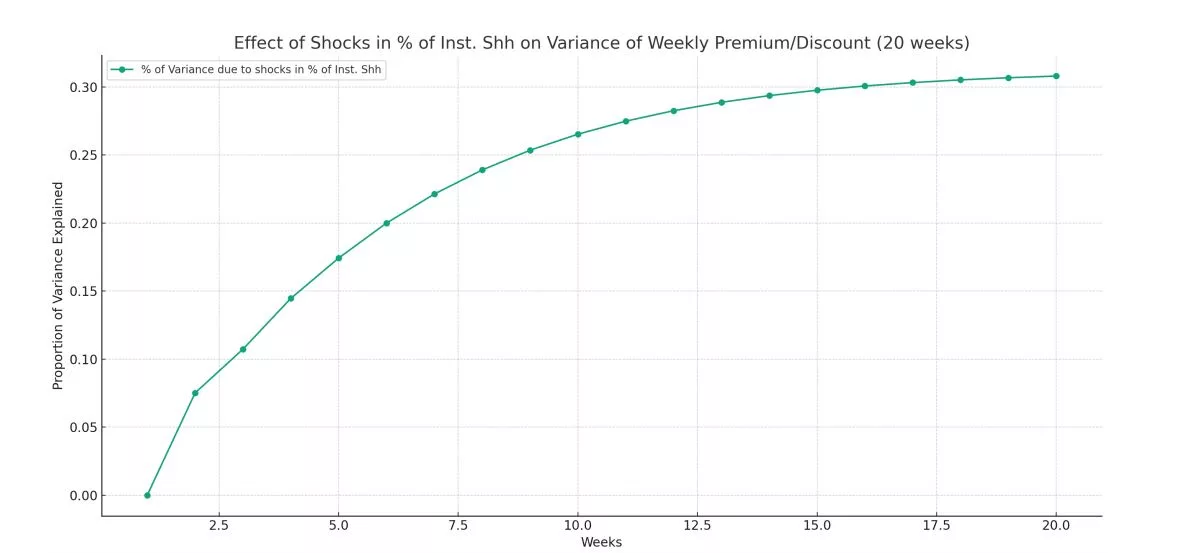
Forecast Error Variance Decomposition (FEVD) of ICAP’s Discount

  • Immediate Effect (Week 1): At the very beginning, shocks in “% of Inst. Shh” account for a relatively small fraction of the variance in ”Weekly Premium/Discount”.
  • Increasing Influence Over Time: The influence of shocks in “% of Inst. Shh” on the volatility of the weekly discount rises gradually over the weeks. This trend suggests a growing impact of changes in institutional ownership on the volatility of the discount/premium over the medium to longer term.
  • Stabilizing Effect: After an initial increase, the proportion of variance attributed to “% of Inst. Shh” seems to stabilize, indicating a consistent influence of institutional ownership on the volatility of the discount/premium in the longer term..

aq9 jpg


Concluding Remarks

  • Performance Metrics: ICAP has consistently demonstrated a superior risk-adjusted performance vs. KLCI.
    • Annual Sharpe ratio:0.38
    • Jensen’s alpha: 1.8%
    • Annual IR: 0.48
  • Discount Dynamics: ICAP’s persistent discount to NAV suggests the influence of factors beyond mere fund performance or asset allocation.
  • Institutional ownership: The empirical findings seem to suggest that as institutional ownership increases, the premium tends to decrease or the discount tends to increase.
  • Possible explanation:
    • Institutional investors frequently hold substantial holdings in closed-end funds. This concentrated ownership can occasionally constrain the daily availability of shares for trading in the open market, commonly referred to as the ”float”.
    • A smaller float can lead to lower market liquidity if fewer shares are available for daily trade.
    • Lower liquidity can result in larger bid-ask spreads, potentially contributing to the discount experienced by closed-end funds.
    • When individual investors perceive difficulties in trading funds’ shares or face adverse selection costs, they might require rationally larger discounts to NAV.


Disclaimer

  • This presentation is strictly for informational and educational purposes and should not be construed as legal, financial, or investment advice. It is presented without any guarantee, representation, or warranty regarding its accuracy, completeness, or suitability for any particular purpose. These views do not represent or imply the endorsement or agreement of any specific institutional investor or entity
  • The content herein is not intended to defame, disparage, or cast aspersions on any organization, company, or individual. All statements and opinions are made in good faith, based upon rigorous academic research and analysis. This presentation does not constitute an offer or solicitation for the purchase or sale of any financial instrument, nor should it be considered as an official confirmation of any transaction.
  • The information provided is subject to change at any time without notice, and there is no commitment to update the presentation in the event of new information or future events. Reproduction, distribution, or publication of this document is strictly prohibited without express prior written consent from the author(s).
  • The responsibility for any decisions, interpretations, or actions based on this presentation lies solely with the individual attending the presentation or accessing this document. By participating in or accessing this presentation, you acknowledge and agree to the limitations and terms set forth in this disclaimer and assume full responsibility for your use of the information provided.